Dengue Infection Trends: Weekly and Bi-Weekly Analysis
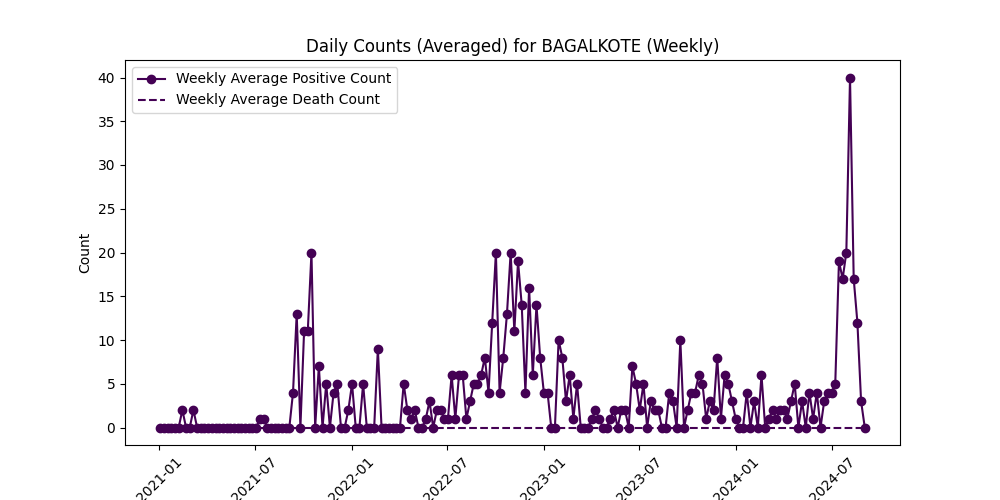
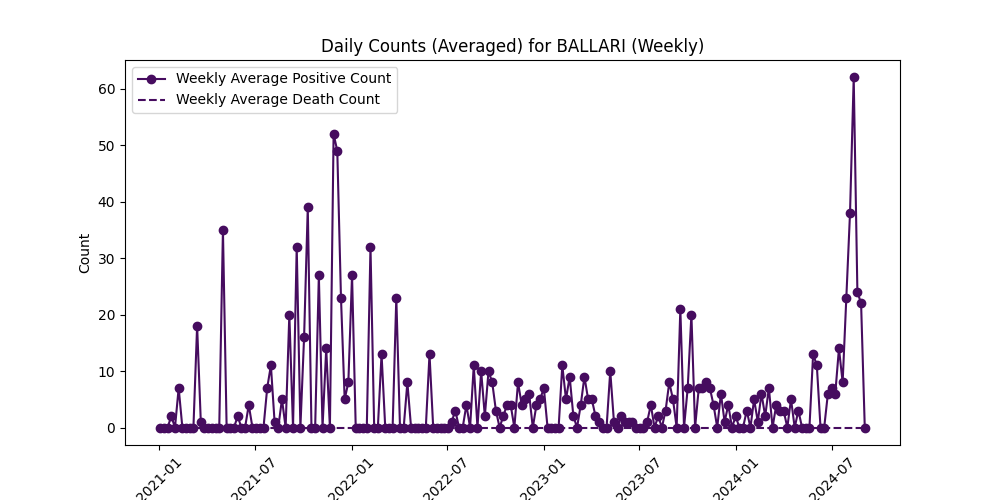
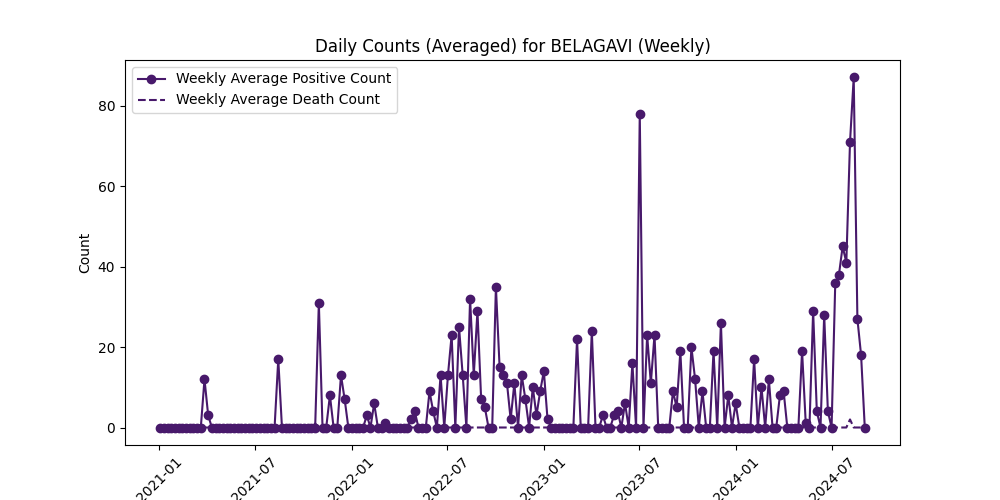
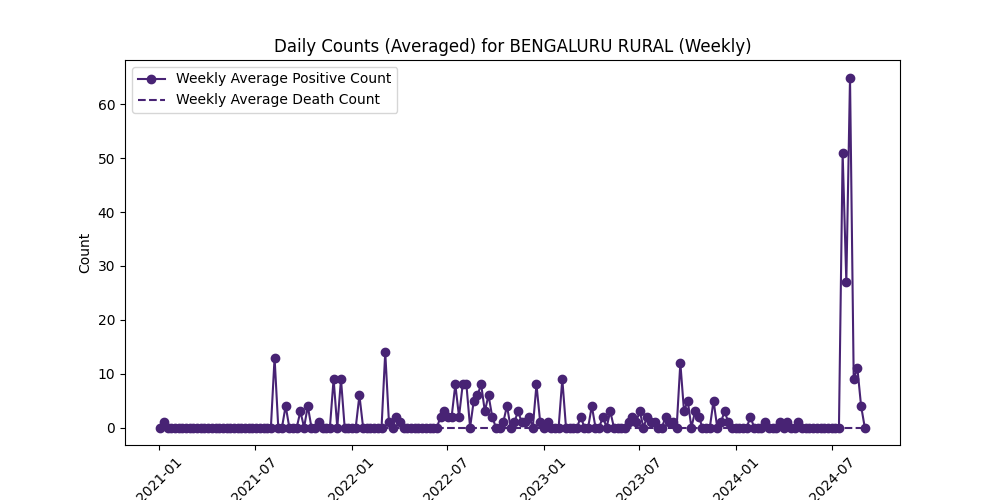
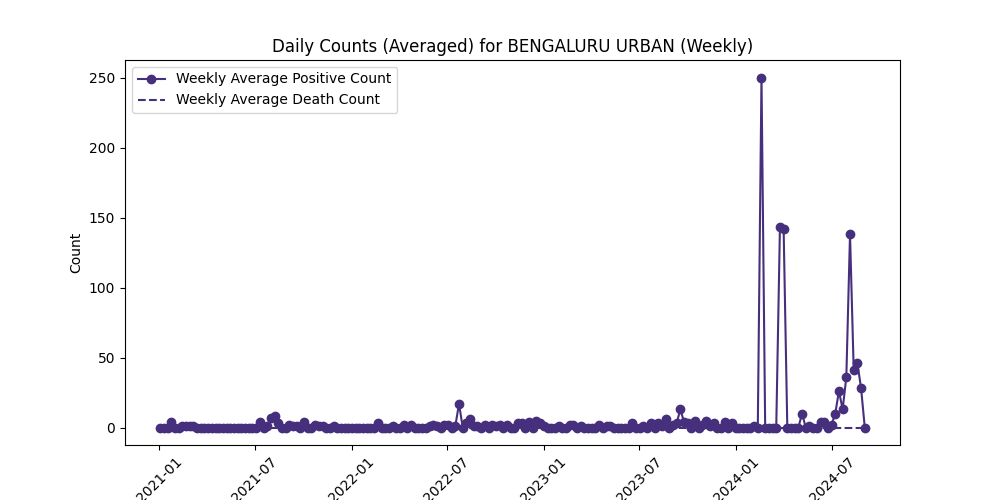
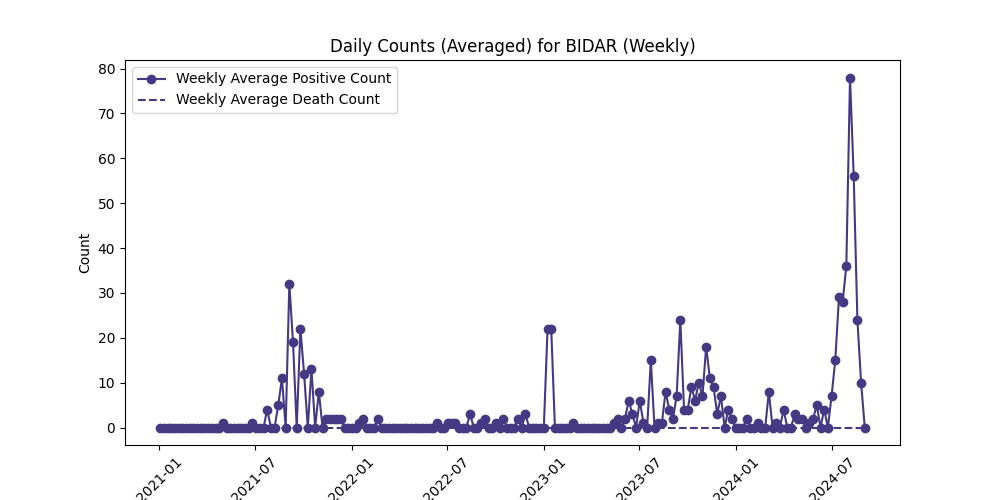
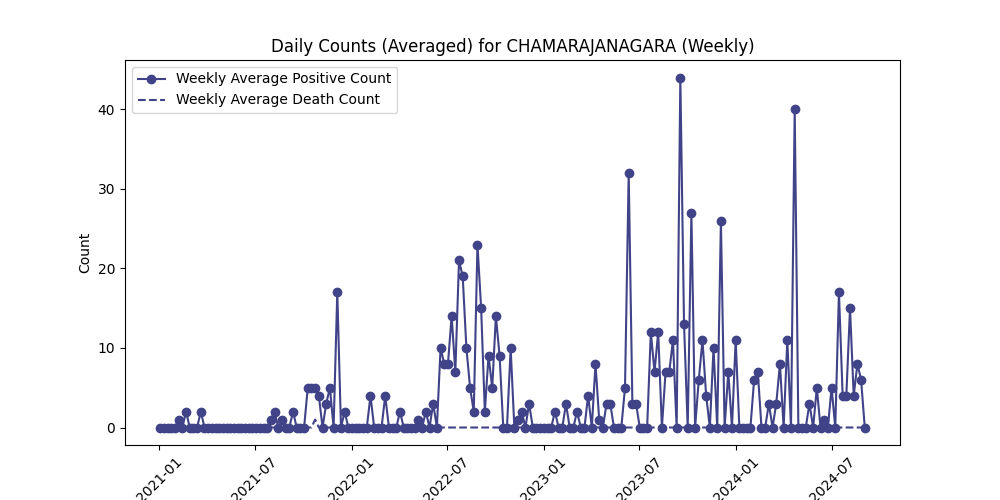
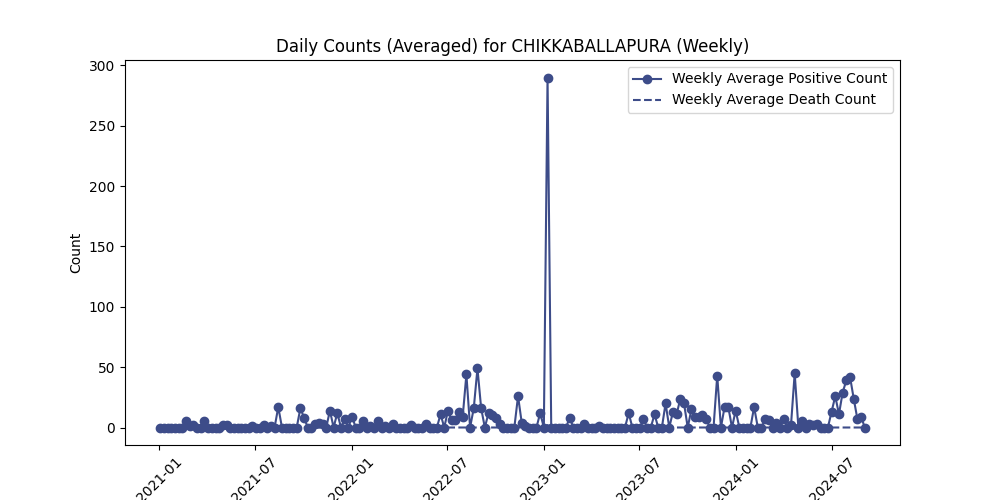
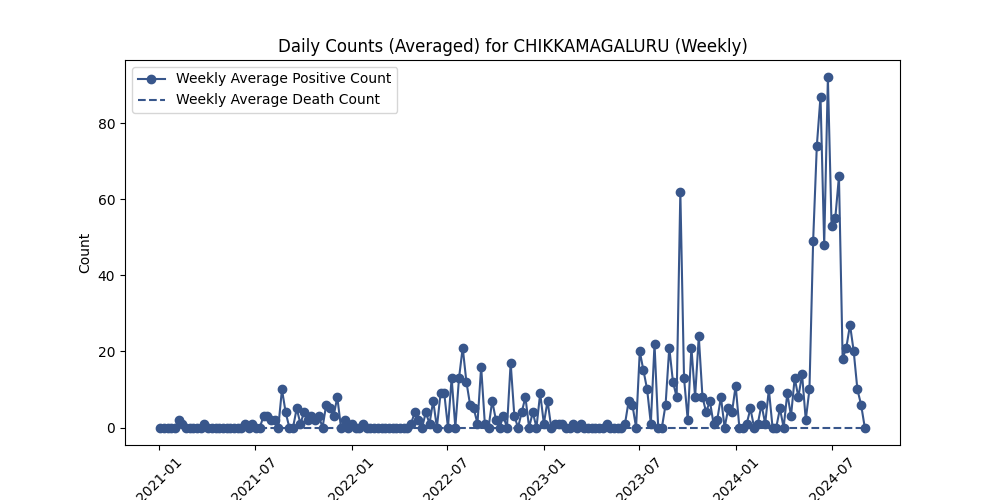
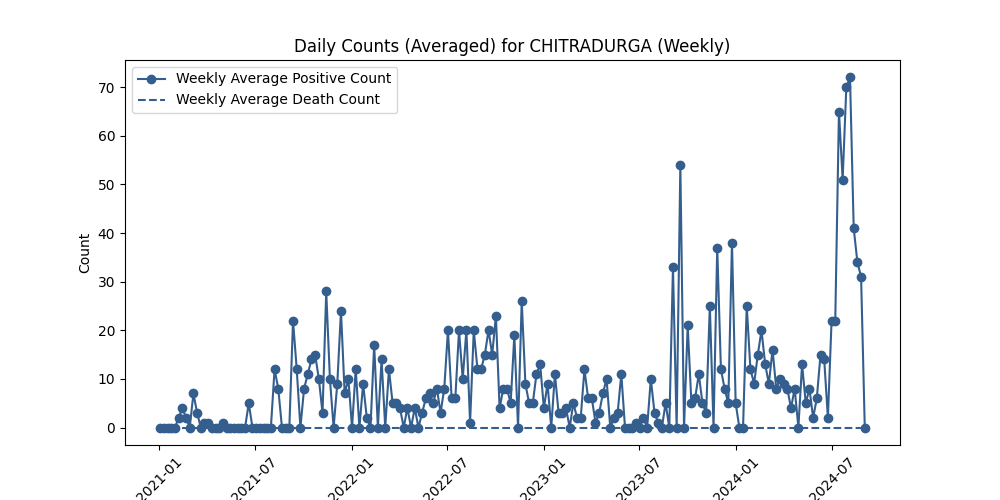
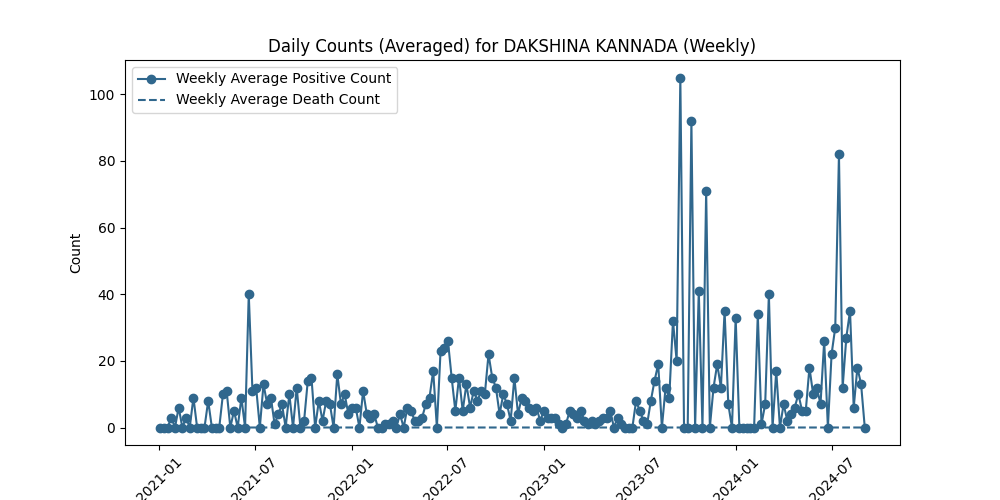
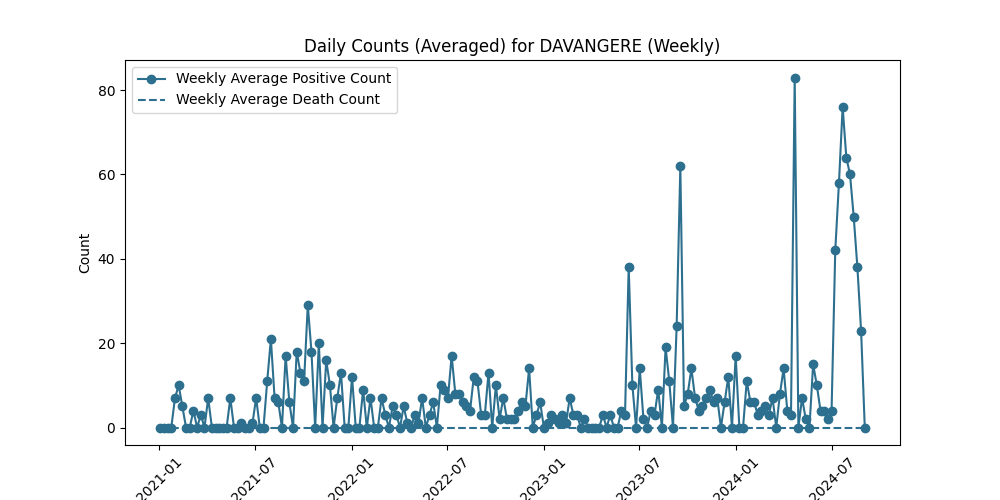
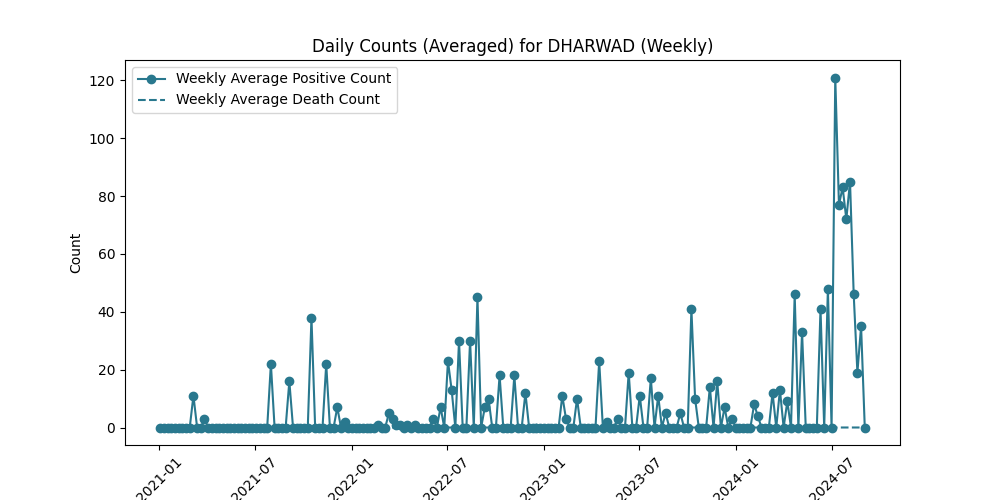
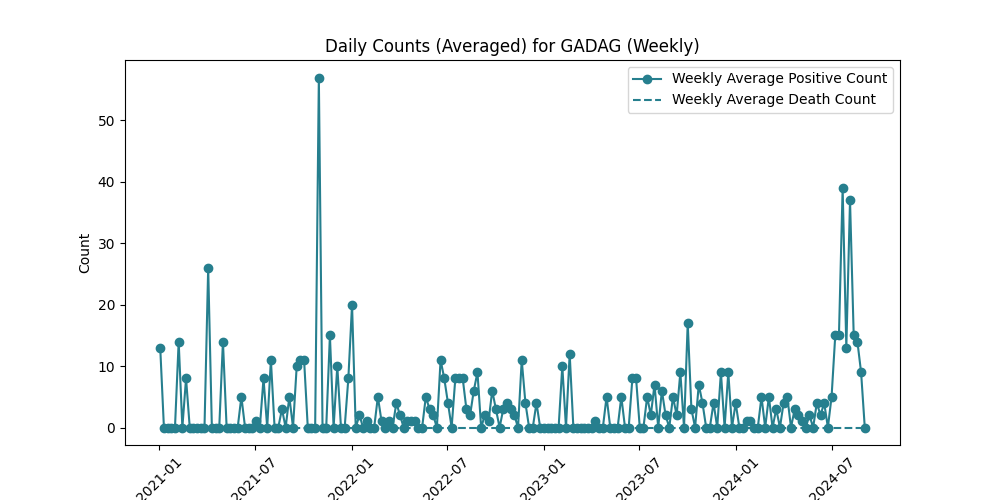
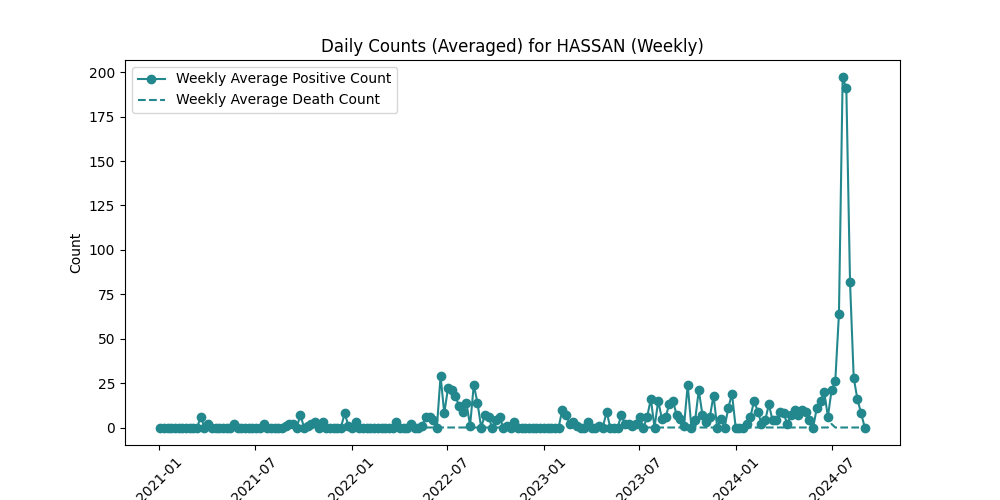
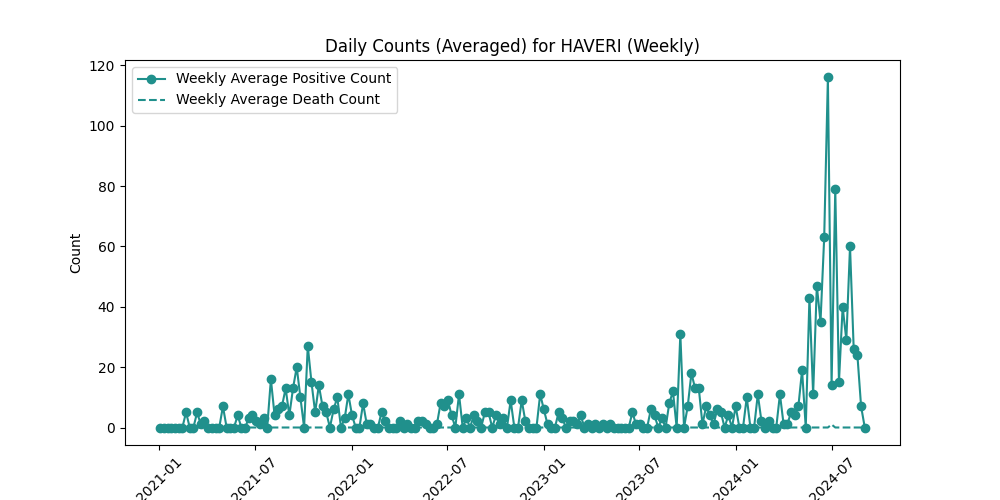
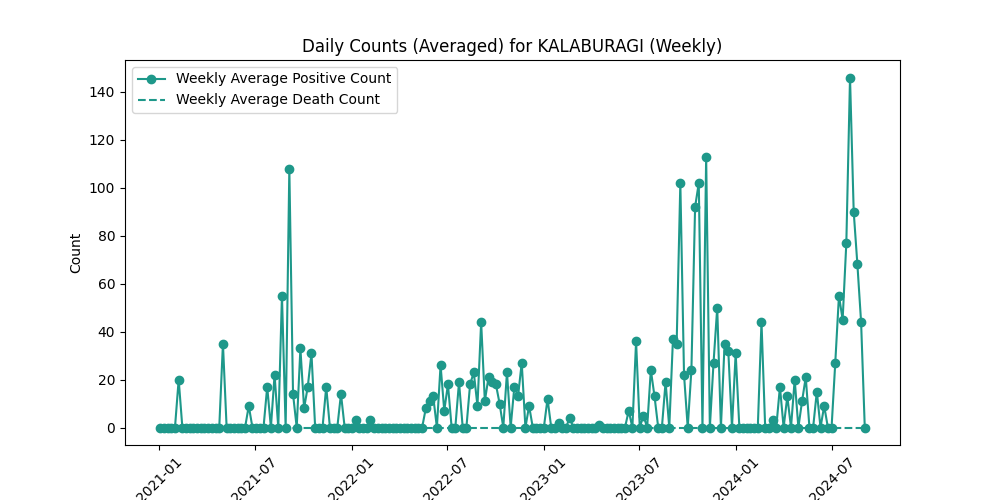
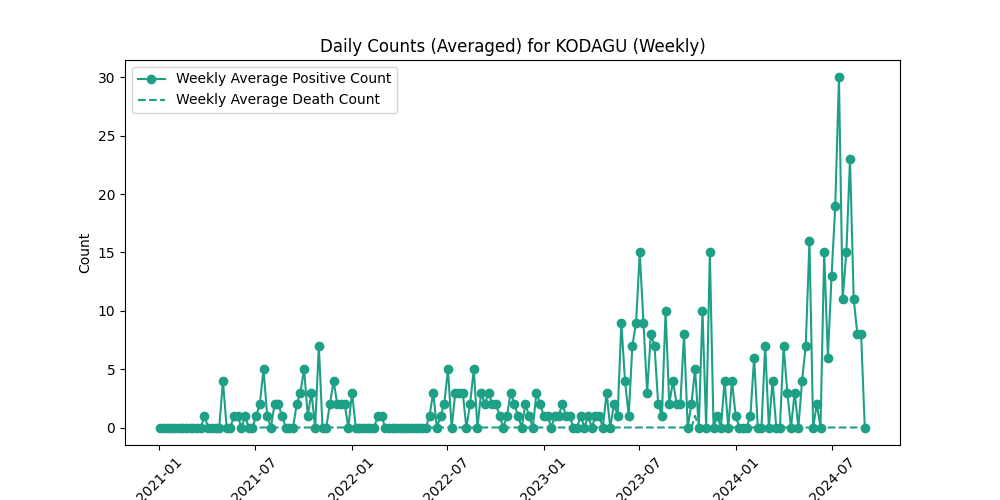
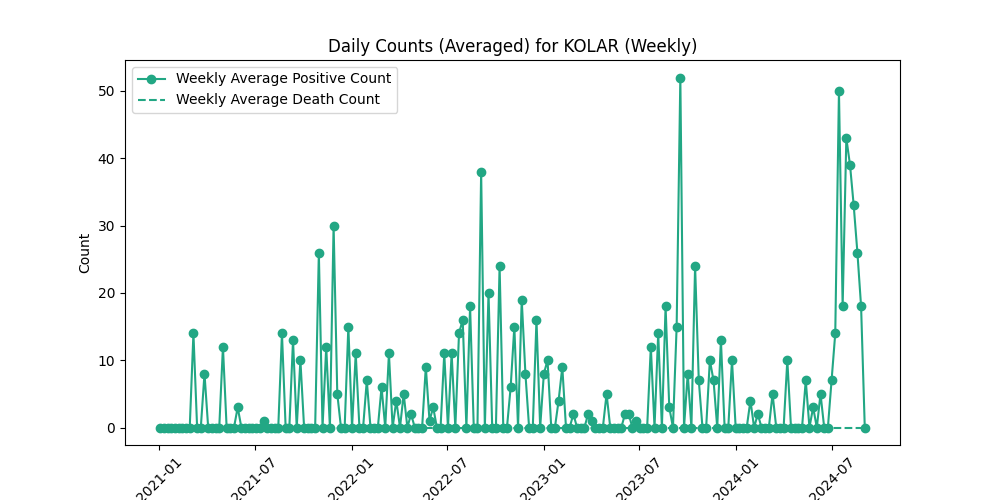
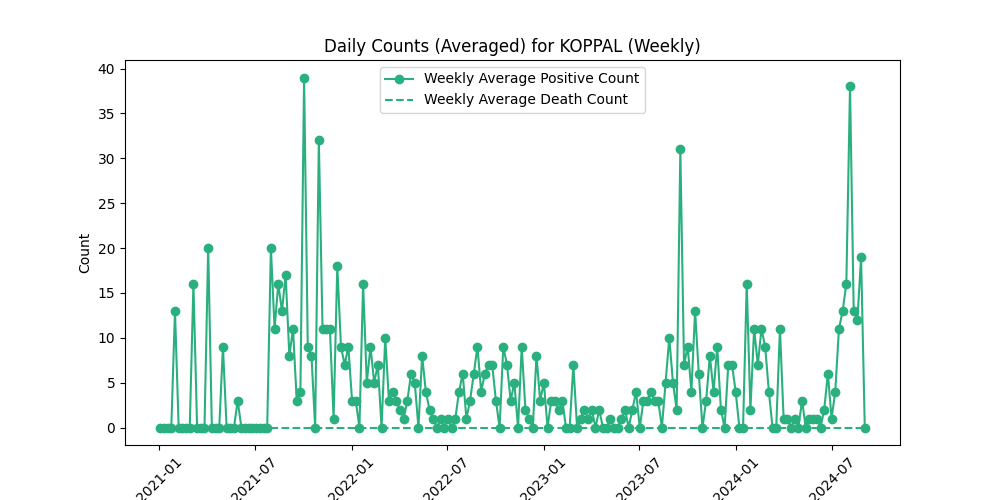
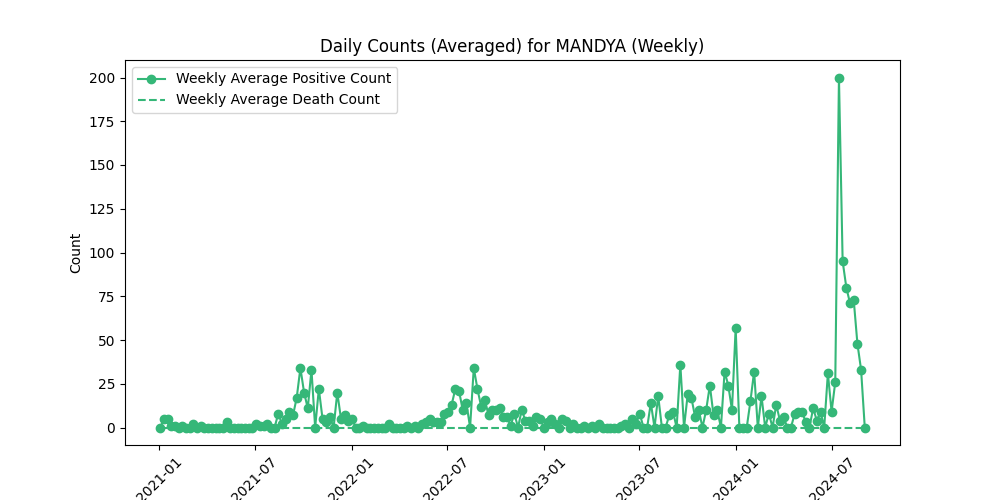
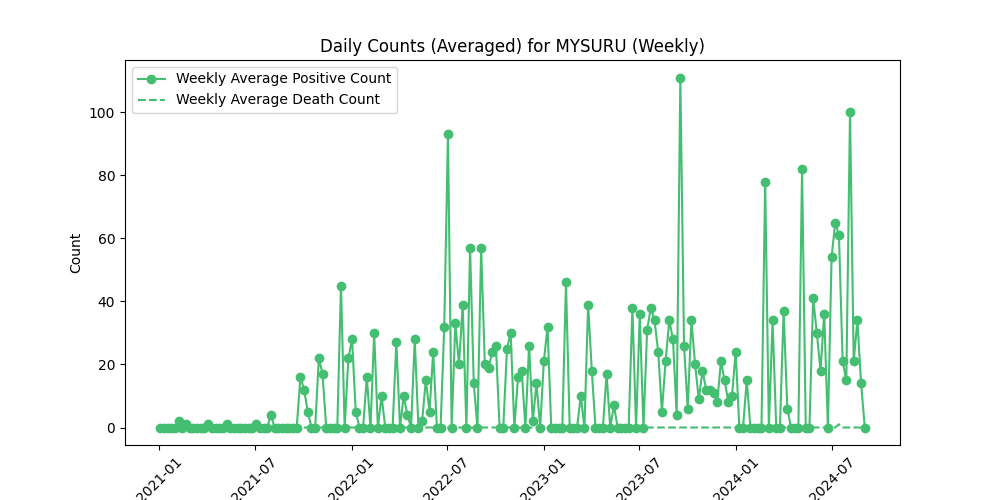
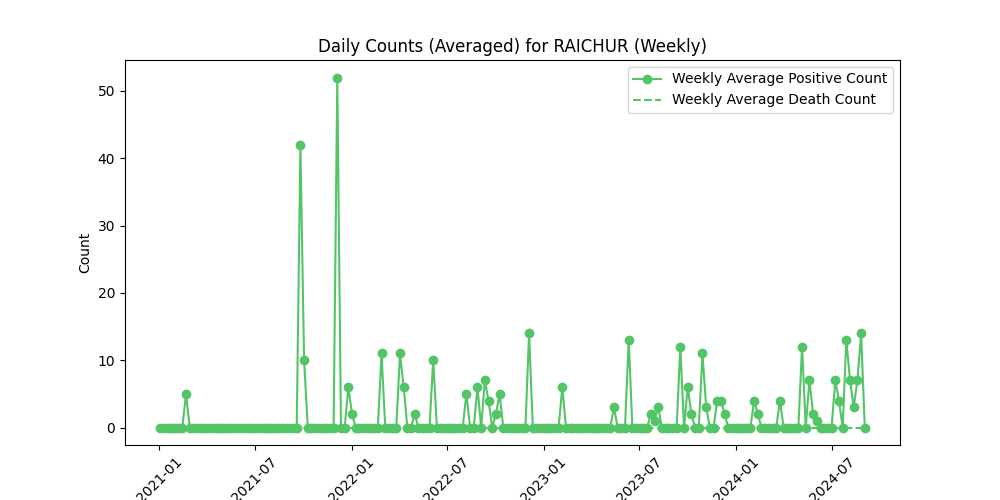
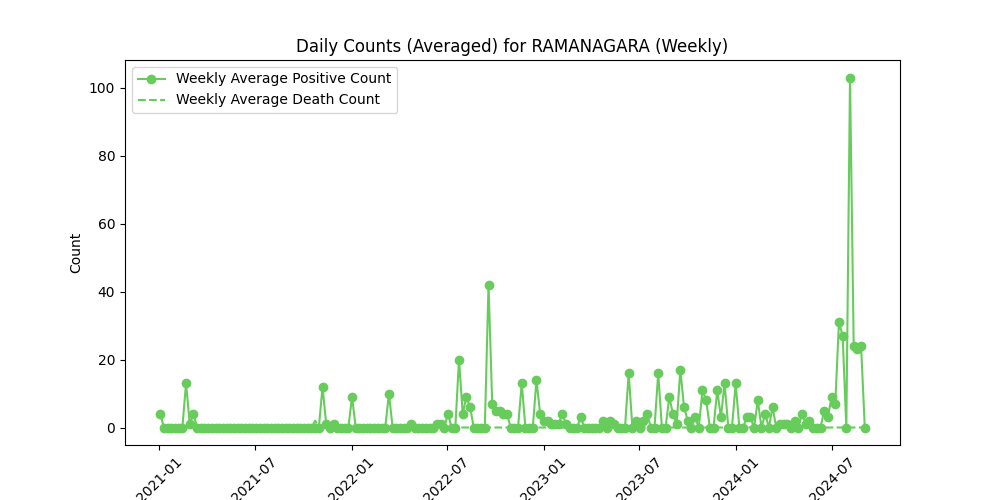
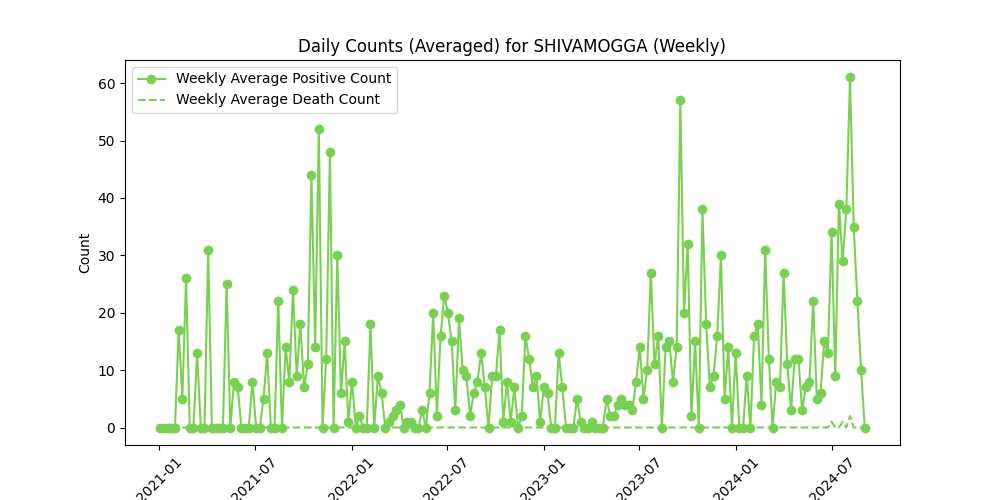
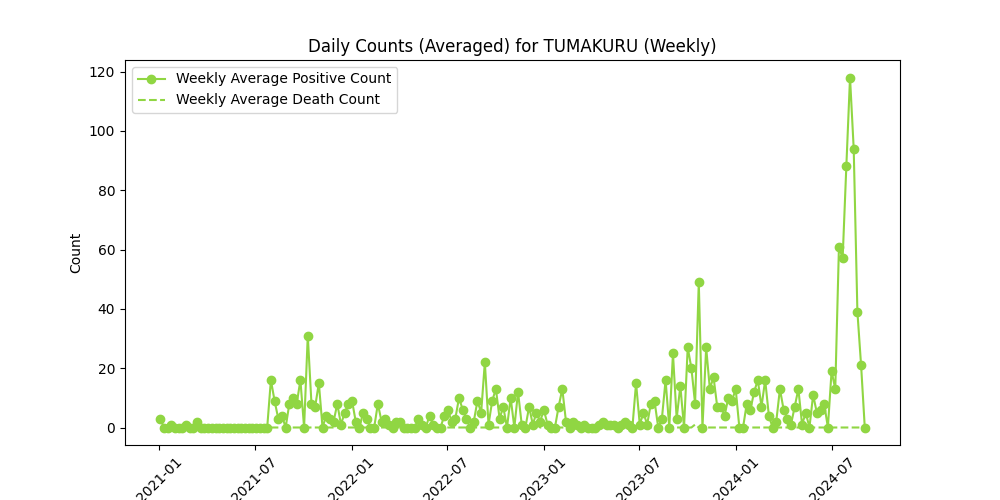
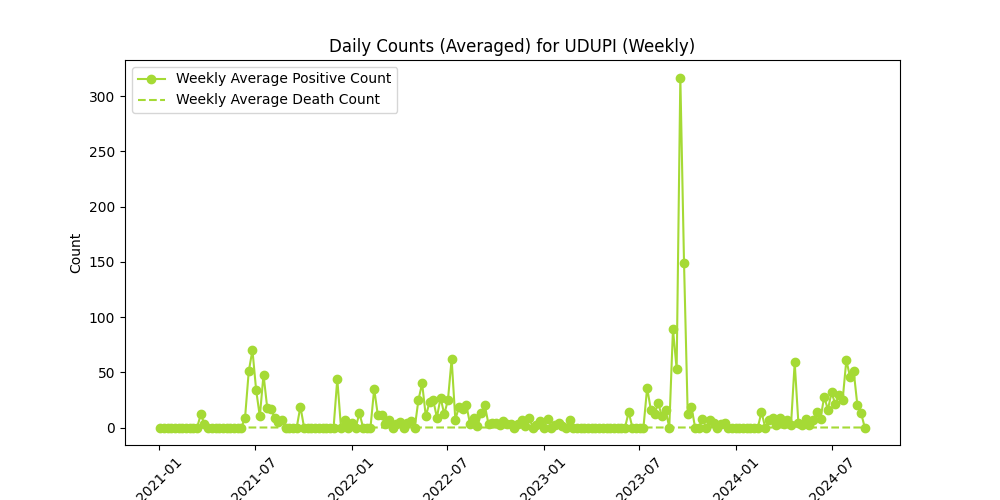
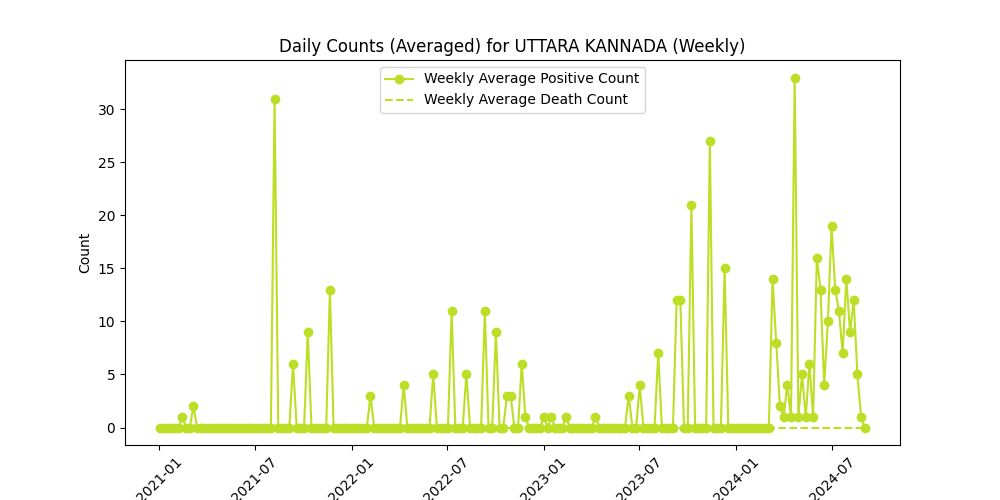
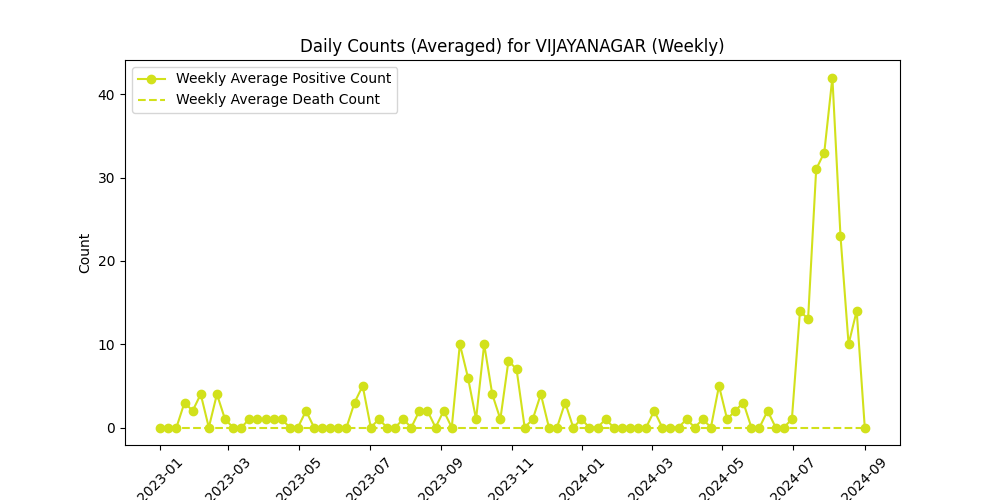
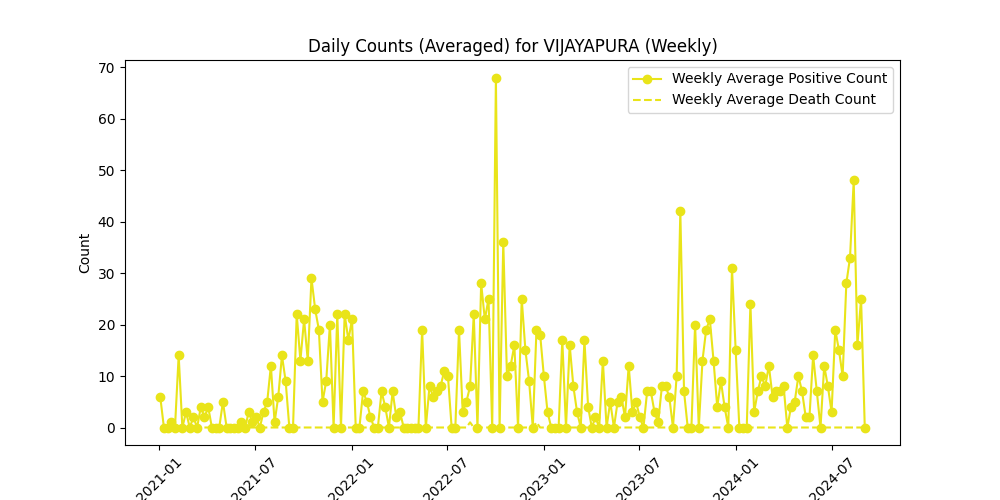
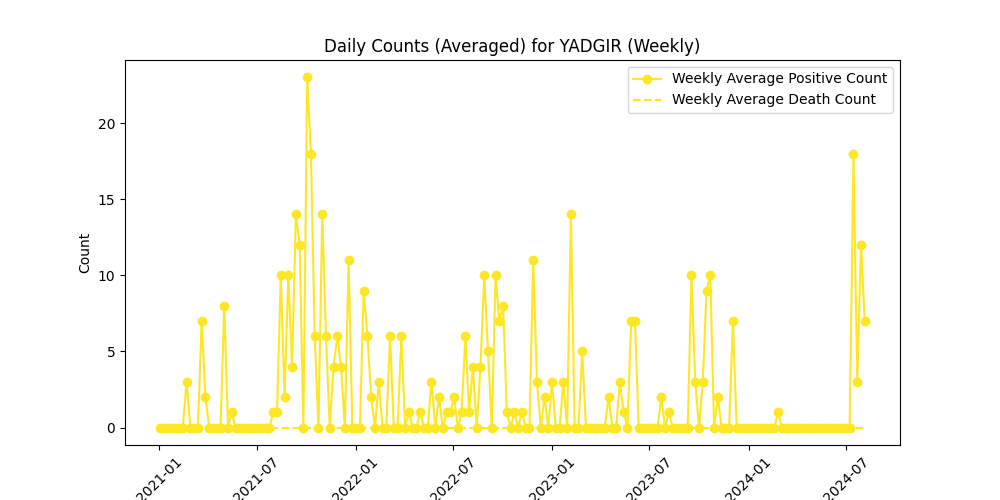
Explore the latest trends in dengue infection rates across various districts. This interactive visualization showcases both weekly and bi-weekly aggregated data, highlighting the average counts of positive cases and related fatalities.
Weekly Trends
Analyze the fluctuations in dengue cases on a week-to-week basis, providing insights into recent spikes or declines in infections.